Market Outlook
June 2, 2017
Market Cues
Domestic Indices
Chg (%)
(Pts)
(Close)
Indian markets are likely to open on Positive note tracking the SGX Nifty and Global
BSE Sensex
(0.0)
(8)
31,138
markets.
Nifty
(0.1)
(5)
9,616
The three major indices of the US Stocks moved mostly higher over the course of the
Mid Cap
0.5
71
14,696
trading session on Thursday, offsetting the weakness seen in the two previous
Small Cap
1.0
154
15,234
sessions. All three stock indexes closed at records as a strong read on private-sector
employment helped to bolster confidence in the economy ahead of Friday’s closely
Bankex
(0.5)
(127)
26,420
watched jobs report.
Global Indices
Chg (%)
(Pts)
(Close)
The S&P 500 index SPX, gained 0.76% to finish at 2,430. The Dow Jones Industrial
Average DJIA rose 0.65% to end at 21,144, and the Nasdaq Composite Index
Dow Jones
0.6
136
21,144
COMP, climbed 0.78% to close at 6,247.
Nasdaq
0.8
48
6,247
FTSE
0.3
24
7,544
Stocks in London clung to their gains after a largely range-bound session that
Nikkei
(01.1
209
19,860
benefited from better-than-expected manufacturing data and amid continuing UK
election jitters. The FTSE 100 pushed up 0.32% to finished at 7,544.
Hang Seng
0.6
149
25,809
Shanghai Com
(0.5)
(15)
3,103
The domestic equity benchmarks closed flat for the second day in a row on Thursday
following weak GDP numbers for March quarter and lack of fresh positive
triggers.BSE Sensex closed lower 0.03%, to end at 31,138, while the Nifty 50 fell
Advances / Declines
BSE
NSE
0.05%, to finish at 9,616.
Advances
1,408
1,935
Declines
1,296
736
News Analysis
Unchanged
171
75
Car sales increase 9% in May
Detailed analysis on Pg2
Volumes (` Cr)
Investor’s Ready Reckoner
BSE
4,066
Key Domestic & Global Indicators
NSE
23,463
Stock Watch: Latest investment recommendations on 150+ stocks
Refer Pg5 onwards
#Net Inflows (` Cr)
Net
Mtd
Ytd
Top Picks
FII
(1,132
( 9,957
51,969
CMP
Target
Upside
Company
Sector
Rating
MFs
8449
8,960
29,642
(`)
(`)
(%)
Blue Star
Capital Goods
Buy
637
760
19.4
Dewan Housing Fin. Financials
Buy
417
520
24.7
Top Gainers
Price (`)
Chg (%)
Mahindra Lifespace Real Estate
Buy
424
522
23.2
Balkrisind
1,587
8.1
Navkar Corporation Others
Buy
218
265
21.6
Vakrangee
389
6.8
KEI Industries
Capital Goods
Accumulate
220
239
8.5
Apollotyre
243
6.3
More Top Picks on Pg3
Ceatltd
1,786
6.2
Key Upcoming Events
Kscl
623
5.6
Previous
Consensus
Date
Region
Event Description
Reading
Expectations
Jun 02, 2017 UK
PMI Manufacturing
56.70
56.50
Top Losers
Price (`)
Chg (%)
Jun 02, 2017 US
Unnemployment rate
4.40
4.40
Videoind
239
(4.9)
Jun 06, 2017 India
RBI Reverse Repo rate
6.00
6.00
Ioc
414
(4.1)
Jun 07, 2017 Germany PMI Services
55.20
Ashokley
91
(3.4)
Jun 07, 2017 Euro Zone Euro-Zone GDP s.a. (QoQ)
0.50
Jun 07, 2017 India
RBI Repo rate
6.25
6.25
Vedl
231
(3.2)
More Events on Pg4
Religare
186
(3.1)
#As on 1st June 2017
Market Outlook
June 2, 2017
News Analysis
Car sales increase 9% in May
Auto majors Maruti Suzuki India Ltd, Honda Cars India Ltd and Mahindra and
Mahindra Ltd posted double digit growth in the domestic sales of their passenger
vehicles in May on the back of new models and utility vehicles.
After 14.7% growth in April, first month of financial year 2017-18, sales in May
are estimated to have grown around 9%, in spite of the possibility of a price cut in
some segment of cars from July 1, when the national goods and services tax (GST)
takes effect.
Market leader Maruti Suzuki reported its domestic sales increased by 15.5% during
the month to 130,676 units, as against 113,162 units in May 2016. The
company’s primarily sales were driven by the entry level cars, compact hatchbacks
and utility vehicles (UV). Sales of its mini segment cars, including, Alto and
WagonR, increased 18.1% to 39,089 units from 33,105 vehicles in the year-ago
month. The sales of the compact segment comprising Swift, Estilo, Dzire, Baleno
and Ignis also grew 10.1% to 51,234 units in May as against 46,554 units in the
same month last year. Besides, sales of utility vehicles, including S- Cross and
Vitara Brezza surged by 66.3% to 22,608 units.
Economic and Political News
India, Russia sign pact for two more units of N-plant, to push nuclear ties
GDP growth of 7-8% 'fairly reasonable': Arun Jaitley
Next GDP series may use FY '17-18 as base: TCA Anant
Corporate News
Fitch downgrades RCom, questions business model
Bharti Airtel gets SEBI, stock exchanges approval for Telenor India buyout
Merger may be preferred route for ONGC, HPCL
Market Outlook
June 2, 2017
Top Picks ★★★★★
Market Cap
CMP
Target
Upside
Company
Rationale
(` Cr)
(`)
(`)
(%)
Strong growth in domestic business due to its leadership
in acute therapeutic segment. Alkem expects to launch
Alkem Laboratories
23,154
1,937
2,161
11.6
more products in USA, which bodes for its international
business.
We expect the company would report strong profitability
Asian Granito
1,145
380
405
6.5
owing to better product mix, higher B2C sales and
amalgamation synergy..
Favourable outlook for the AC industry to augur well for
Cooling products business which is out pacing the market
Blue Star
6,087
637
760
19.4
growth. EMPPAC division's profitability to improve once
operating environment turns around..
With a focus on the low and medium income (LMI)
consumer segment, the company has increased its
Dewan Housing Finance
13,064
417
520
24.7
presence in tier-II & III cities where the growth opportunity
is immense.
Strong loan growth backed by diversified loan portfolio
and adequate CAR. ROE & ROA likely to remain decent
Equitas Holdings
5,296
157
235
50.0
as risk of dilution remains low. Attractive valuations
considering growth.
Economic recovery to have favourable impact on
advertising & circulation revenue growth. Further, the
Jagran Prakashan
5,853
179
225
25.6
acquisition of a radio business (Radio City) would also
boost the company's revenue growth.
High order book execution in EPC segment, rising B2C
KEI Industries
1,710
220
239
8.5
sales and higher exports to boost the revenues and
profitability
Speedier execution and speedier sales, strong revenue
Mahindra Lifespace
2,174
424
522
23.2
visibilty in short-to-long run, attractive valuations
Massive capacity expansion along with rail advantage at
Navkar Corporation
3,109
218
265
21.6
ICD as well CFS augurs well for the company
Market leadership in Hindi news genre and no.
2
viewership ranking in English news genre, exit from the
TV Today Network
1,571
263
344
30.6
radio business, and anticipated growth in ad spends by
corporates to benefit the stock.
Source: Company, Angel Research
Market Outlook
June 2, 2017
Key Upcoming Events
Global economic events release calendar
Bloomberg Data
Date
Time
Country
Event Description
Unit
Period
Last Reported
Estimated
Jun 02, 2017
2:00 PMUK
PMI Manufacturing
Value
May
56.70
56.50
6:00 PMUS
Unnemployment rate
%
May
4.40
4.40
Jun 06, 2017
2:30 PMIndia
RBI Reverse Repo rate
%
Jun 7
6.00
6.00
Jun 07, 2017
1:25 PMGermany
PMI Services
Value
May F
55.20
2:30 PMEuro Zone
Euro-Zone GDP s.a. (QoQ)
% Change
1Q F
0.50
2:30 PMIndia
RBI Repo rate
%
Jun 7
6.25
6.25
2:30 PMIndia
RBI Cash Reserve ratio
%
Jun 7
4.00
4.00
Jun 08, 2017
China
Exports YoY%
% Change
May
8.00
5:15 PMEuro Zone
ECB announces interest rates
%
Jun 8
-
Jun 09, 2017
2:00 PMUK
Industrial Production (YoY)
% Change
Apr
1.40
7:00 AMChina
Consumer Price Index (YoY)
% Change
May
1.20
1.40
Jun 12, 2017
5:30 PMIndia
Industrial Production YoY
% Change
Apr
2.70
Jun 13, 2017
2:00 PMUK
CPI (YoY)
% Change
May
2.70
US
Producer Price Index (mom)
% Change
May
0.60
Jun 14, 2017
India
Exports YoY%
% Change
May
19.80
India
Imports YoY%
% Change
May
49.10
2:00 PMUK
Jobless claims change
% Change
May
19.40
7:30 AMChina
Industrial Production (YoY)
% Change
May
6.50
6:00 PMUS
Consumer price index (mom)
% Change
May
0.20
-
12:00 PMIndia
Monthly Wholesale Prices YoY%
% Change
May
3.85
11:30 PMUS
FOMC rate decision
%
Jun 14
1.00
1.25
Jun 15, 2017
6:45 PMUS
Industrial Production
%
May
0.98
0.20
4:30 PMUK
BOE Announces rates
% Ratio
Jun 15
0.25
Jun 16, 2017
2:30 PMEuro Zone
Euro-Zone CPI (YoY)
%
May F
1.40
6:00 PMUS
Building permits
Thousands
May
1,260.00
1,250.00
7:30 PMUS
Existing home sales
Million
May
5.57
Source: Bloomberg, Angel Research
Market Outlook
June 2, 2017
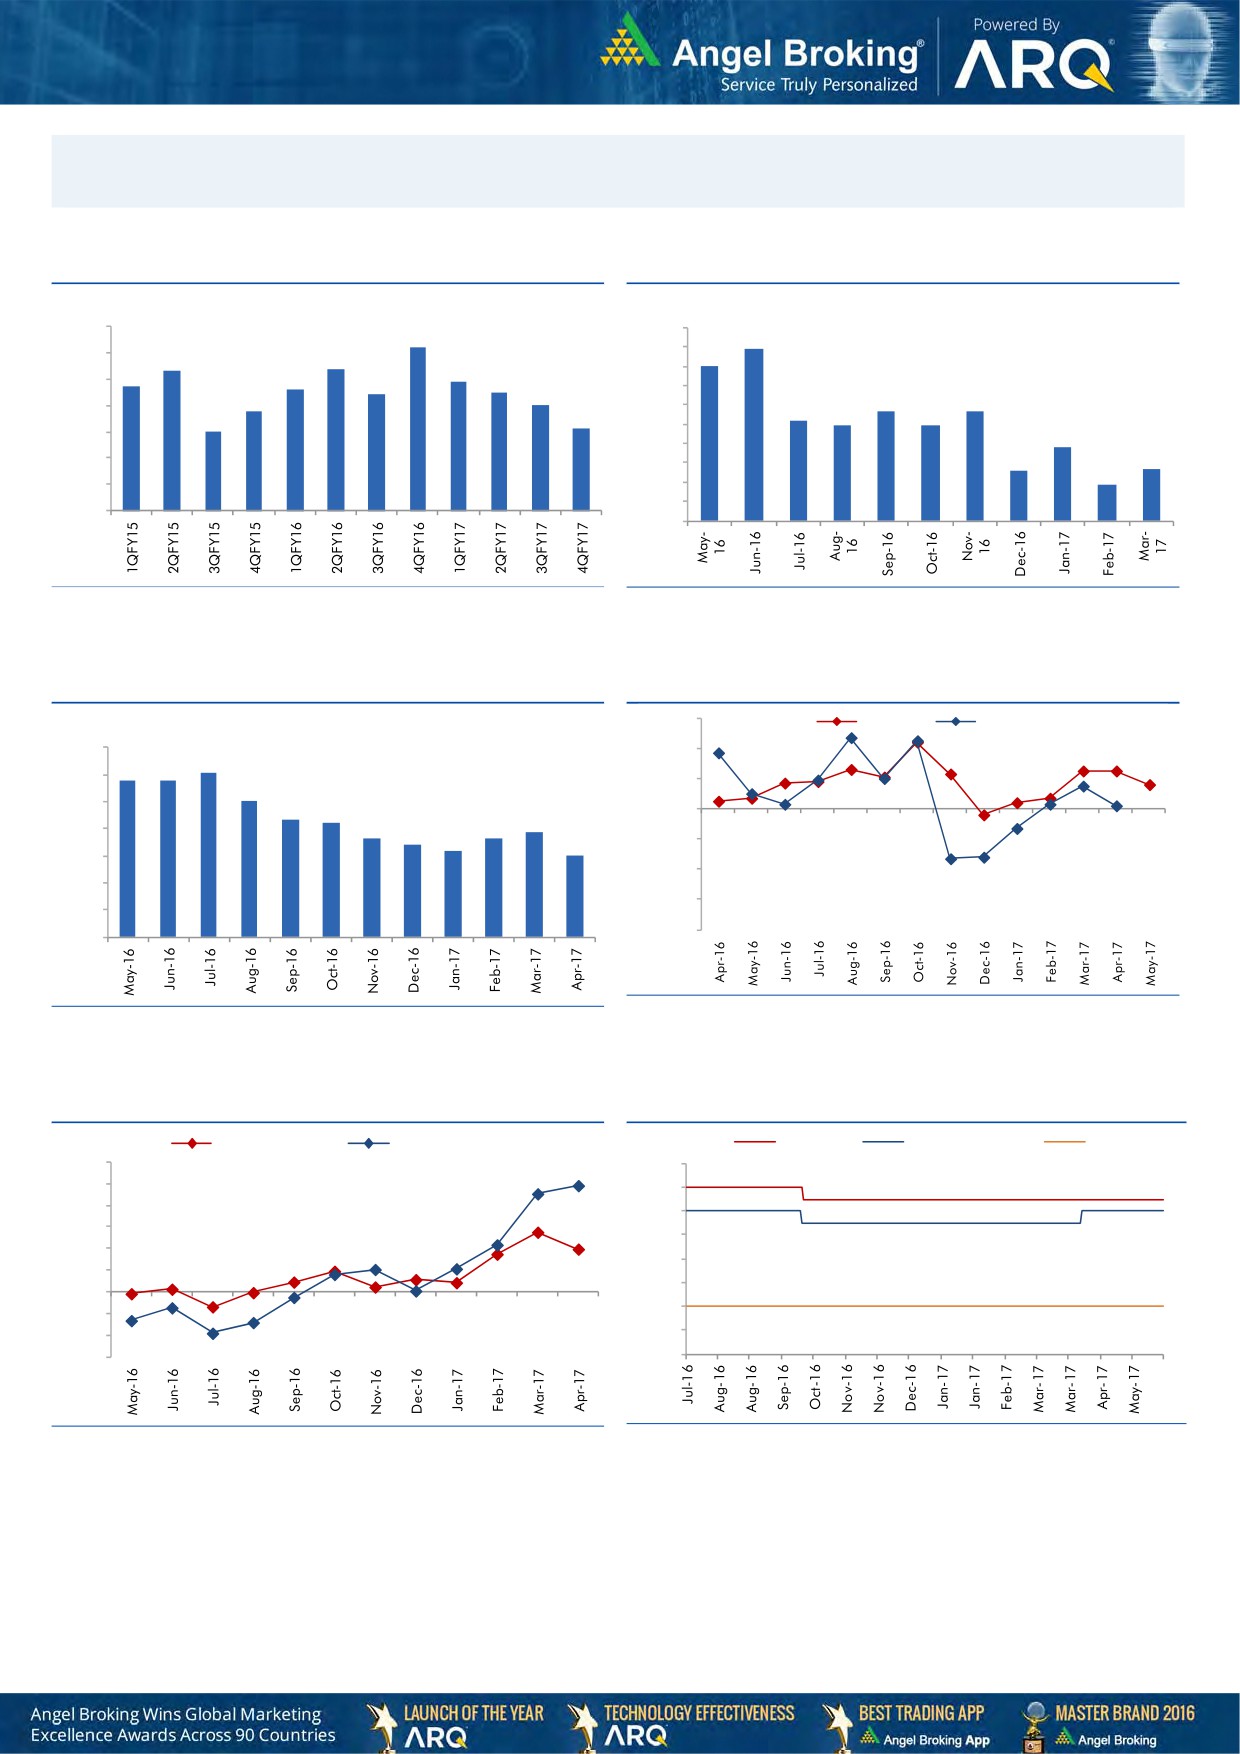
Macro watch
Exhibit 1: Quarterly GDP trends
Exhibit 2: IIP trends
(%)
(%)
10.0
9.2
10.0
8.9
9.0
8.3
8.4
9.0
8.0
7.7
7.9
8.0
7.6
7.5
8.0
7.4
7.0
7.0
6.8
5.7
5.7
7.0
6.0
5.2
4.9
4.9
6.0
6.1
6.0
5.0
3.8
4.0
2.6
2.7
5.0
3.0
1.9
4.0
2.0
1.0
3.0
-
Source: CSO, Angel Research
Source: MOSPI, Angel Research
Exhibit 3: Monthly CPI inflation trends
Exhibit 4: Manufacturing and services PMI
56.0
Mfg. PMI
Services PMI
(%)
7.0
54.0
6.1
5.8
5.8
6.0
52.0
5.1
5.0
4.3
4.2
50.0
3.9
3.6
3.7
4.0
3.4
3.2
3.0
48.0
3.0
46.0
2.0
44.0
1.0
42.0
-
Source: Market, Angel Research; Note: Level above 50 indicates expansion
Source: MOSPI, Angel Research
Exhibit 5: Exports and imports growth trends
Exhibit 6: Key policy rates
(%)
Exports yoy growth
Imports yoy growth
(%)
Repo rate
Reverse Repo rate
CRR
60.0
7.00
50.0
6.50
40.0
6.00
30.0
5.50
20.0
5.00
10.0
4.50
0.0
4.00
(10.0)
(20.0)
3.50
(30.0)
3.00
Source: Bloomberg, Angel Research
Source: RBI, Angel Research
Market Outlook
June 2, 2017
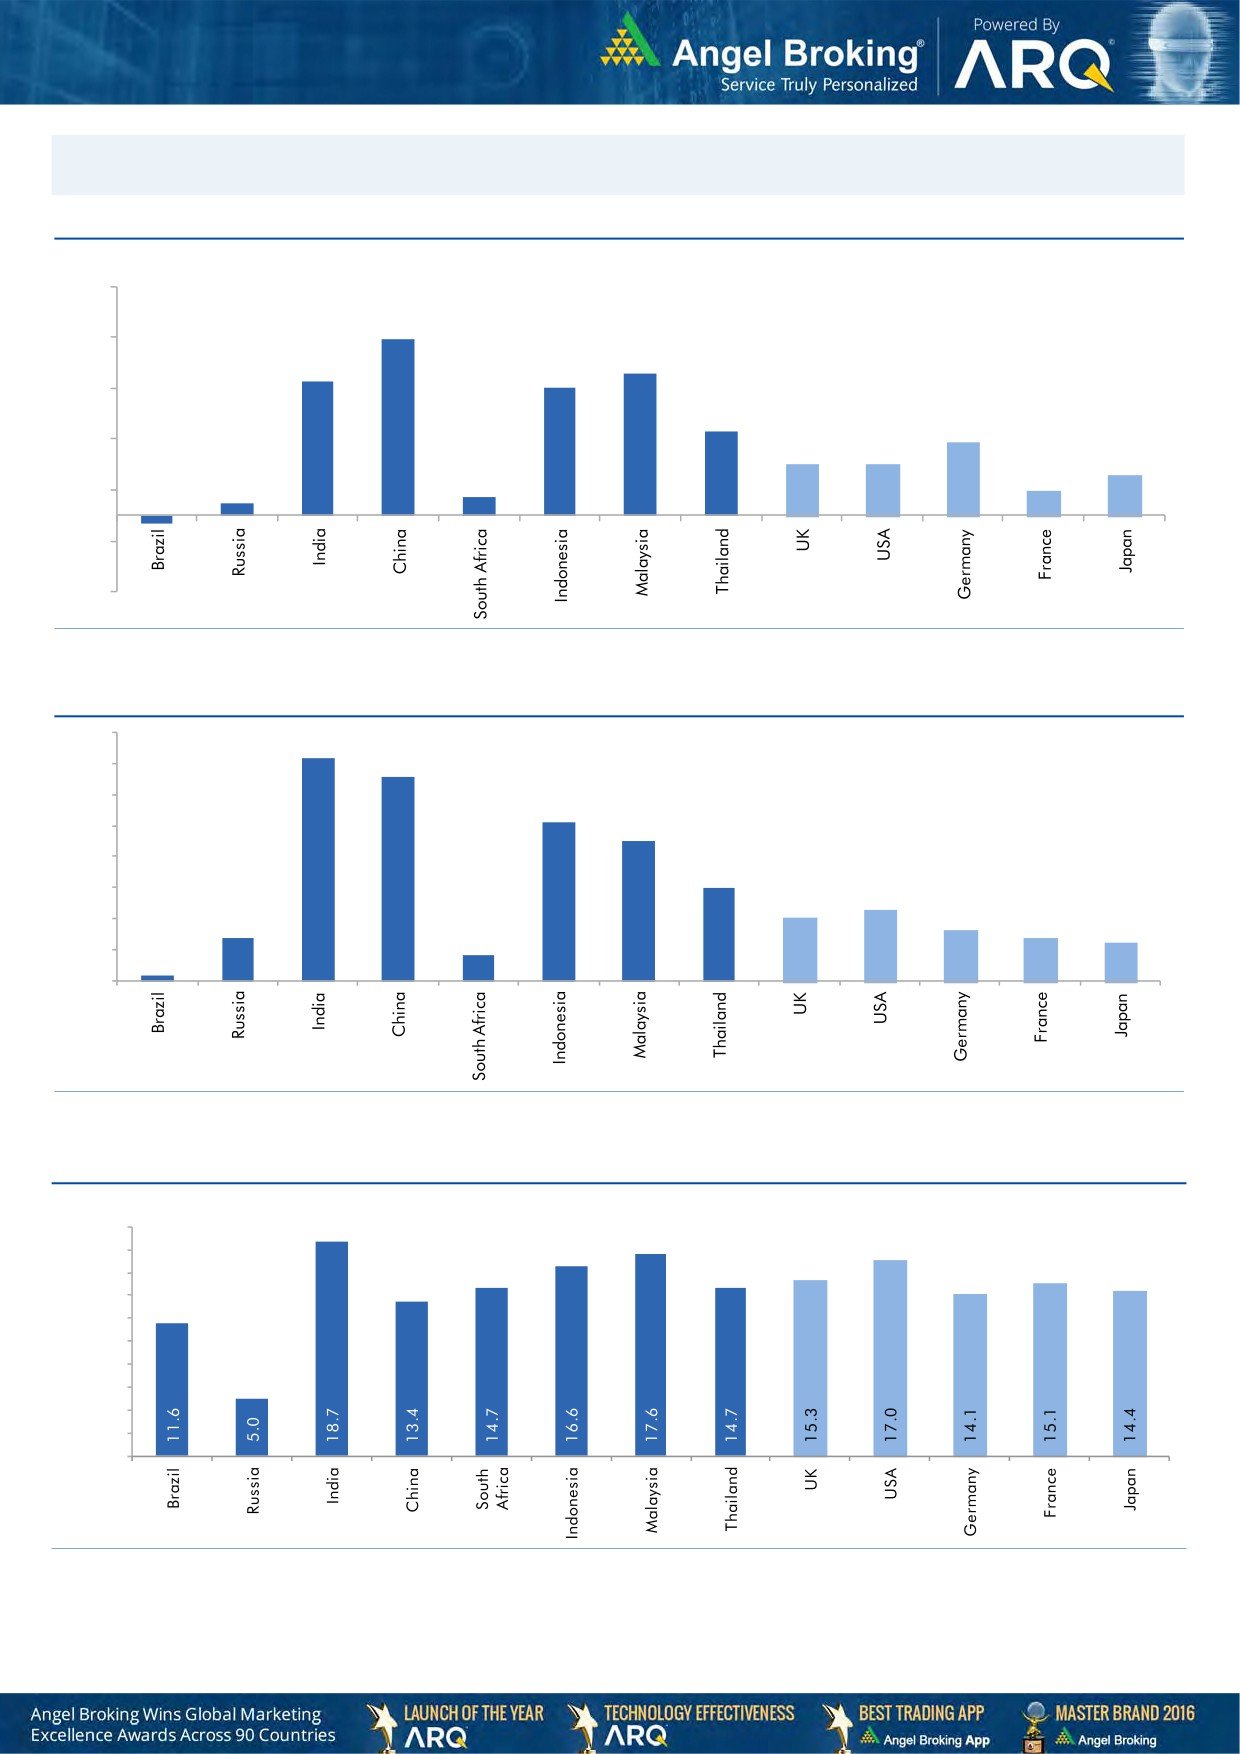
Global watch
Exhibit 1: Latest quarterly GDP Growth (%, yoy) across select developing and developed countries
(%)
9.0
6.9
7.0
5.6
5.3
0.7
5.0
5.0
3.3
2.9
3.0
2.0
2.0
0.5
1.6
1.0
1.0
(1.0)
(0.4)
(3.0)
Source: Bloomberg, Angel Research
Exhibit 2: 2016 GDP Growth projection by IMF (%, yoy) across select developing and developed countries
(%)
7.2
6.6
7.0
6.0
5.1
5.0
4.5
4.0
3.0
3.0
2.3
2.0
1.4
1.6
2.0
1.4
1.2
0.2
0.8
1.0
-
Source: IMF, Angel Research
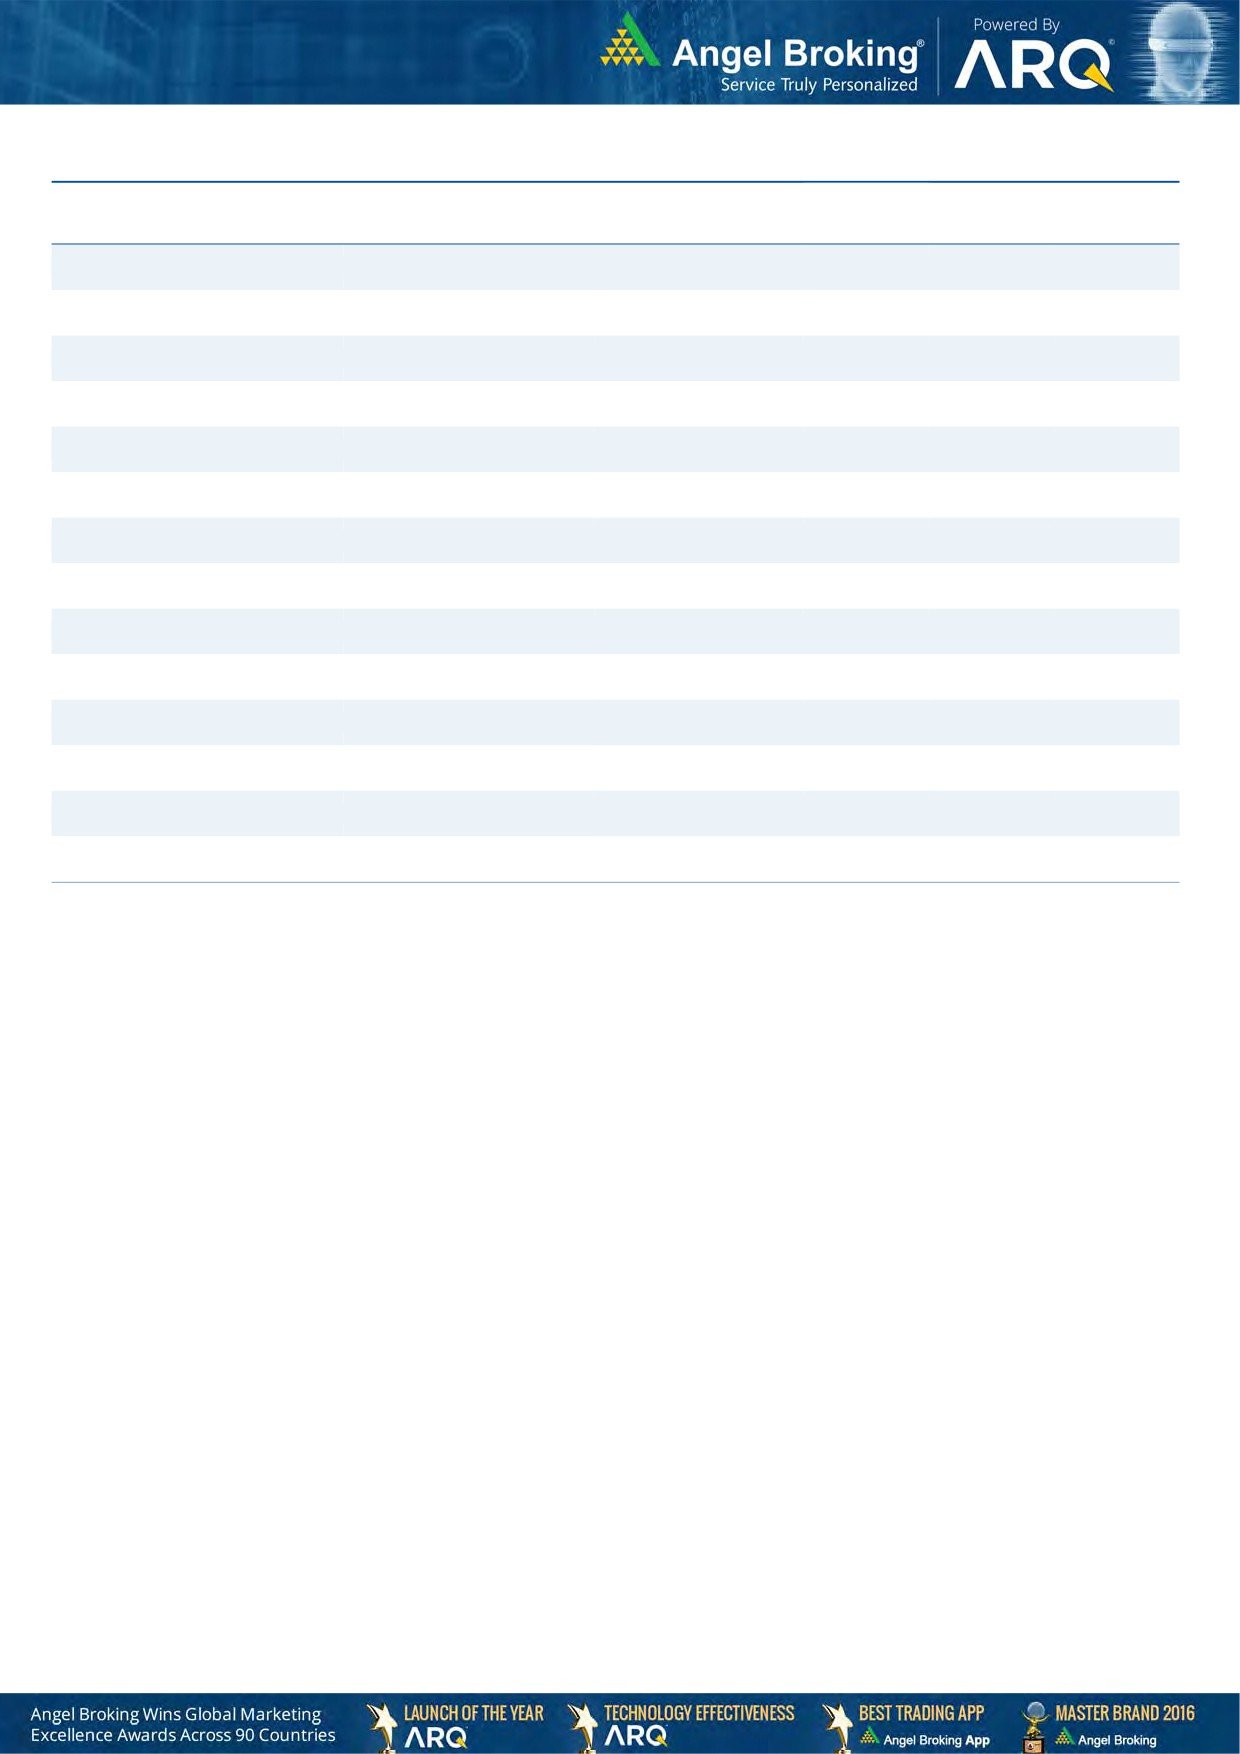
Exhibit 3: One year forward P-E ratio across select developing and developed countries
(x)
20.0
18.0
16.0
14.0
12.0
10.0
8.0
6.0
4.0
2.0
-
Source: IMF, Angel Research
Market Outlook
June 2, 2017
Exhibit 4: Relative performance of indices across globe
Returns (%)
Country
Name of index
Closing price
1M
3M
1YR
Brazil
Bovespa
62,289
(6.6)
(6.6)
28.5
Russia
Micex
1,870
(7.1)
(9.1)
(0.9)
India
Nifty
9,616
3.2
8.1
17.9
China
Shanghai Composite
3,103
(1.9)
(4.1)
10.3
South Africa
Top 40
46,488
(1.4)
4.3
(4.0)
Mexico
Mexbol
49,102
(1.0)
3.7
7.9
Indonesia
LQ45
958
1.5
7.7
19.3
Malaysia
KLCI
1,763
(0.3)
3.9
8.1
Thailand
SET 50
988
(0.6)
0.6
10.8
USA
Dow Jones
21,144
1.1
0.1
18.5
UK
FTSE
7,544
4.7
4.0
21.5
Japan
Nikkei
19,860
3.2
3.9
18.5
Germany
DAX
12,665
1.3
7.0
24.0
France
CAC
5,319
0.3
9.5
20.7
Source: Bloomberg, Angel Research
Stock Watch
June 02, 2017
Company Name
Reco
CMP
Target
Mkt Cap
Sales ( Čcr )
OPM(%)
EPS (Č)
PER(x)
P/BV(x)
RoE(%)
EV/Sales(x)
(Č)
Price ( Č)
( Č cr )
FY17E FY18E
FY17E
FY18E
FY17E
FY18E
FY17E
FY18E
FY17E
FY18E
FY17E
FY18E
FY17E
FY18E
Agri / Agri Chemical
Rallis
Neutral
246
-
4,788
1,937
2,164
13.3
14.3
9.0
11.0
27.4
22.4
4.8
4.2
18.4
19.8
2.5
2.2
United Phosphorus
Neutral
876
-
44,486
15,176
17,604
18.5
18.5
37.4
44.6
23.4
19.6
4.6
3.8
21.4
21.2
3.0
2.6
Auto & Auto Ancillary
Ashok Leyland
Buy
91
111
25,969
20,021
21,915
11.6
11.9
4.5
5.3
20.3
17.2
4.1
3.7
20.6
21.5
1.2
1.1
Bajaj Auto
Neutral
2,841
-
82,202
25,093
27,891
19.5
19.2
143.9
162.5
19.7
17.5
5.5
4.8
30.3
29.4
3.0
2.6
Bharat Forge
Neutral
1,206
-
28,067
7,726
8,713
20.5
21.2
35.3
42.7
34.2
28.2
6.3
5.7
18.9
20.1
3.7
3.2
Eicher Motors
Neutral
28,756
-
78,280
16,583
20,447
17.5
18.0
598.0
745.2
48.1
38.6
16.4
12.5
41.2
38.3
4.5
3.6
Gabriel India
Neutral
130
-
1,870
1,544
1,715
9.0
9.3
5.4
6.3
24.1
20.7
4.6
4.0
18.9
19.5
1.2
1.0
Hero Motocorp
Neutral
3,735
-
74,578
28,083
30,096
15.3
15.7
171.8
187.0
21.7
20.0
7.6
6.4
30.1
27.9
2.5
2.3
Jamna Auto Industries Neutral
258
-
2,058
1,486
1,620
9.8
9.9
15.0
17.2
17.2
15.0
3.8
3.2
21.8
21.3
1.5
1.3
L G Balakrishnan & Bros Neutral
704
-
1,105
1,302
1,432
11.6
11.9
43.7
53.0
16.1
13.3
2.3
2.1
13.8
14.2
0.9
0.9
Mahindra and Mahindra Neutral
1,424
-
88,462
46,534
53,077
11.6
11.7
67.3
78.1
21.2
18.3
3.4
3.0
15.4
15.8
1.9
1.6
Maruti
Neutral
7,144
-
215,798
67,822
83,288
16.0
16.4
253.8
312.4
28.2
22.9
6.5
5.2
23.0
22.9
2.8
2.2
Minda Industries
Neutral
626
-
5,409
2,728
3,042
9.0
9.1
68.2
86.2
9.2
7.3
2.1
1.7
23.8
24.3
2.0
1.8
Motherson Sumi
Neutral
448
-
62,893
45,896
53,687
7.8
8.3
13.0
16.1
34.4
27.8
11.1
8.8
34.7
35.4
1.4
1.2
Rane Brake Lining
Neutral
1,111
-
879
511
562
11.3
11.5
28.1
30.9
39.5
36.0
6.0
5.5
15.3
15.0
1.9
1.7
Setco Automotive
Neutral
39
-
523
741
837
13.0
13.0
15.2
17.0
2.6
2.3
0.4
0.4
15.8
16.3
1.1
1.0
Tata Motors
Neutral
476
-
137,553
300,209
338,549
8.9
8.4
42.7
54.3
11.2
8.8
1.8
1.5
15.6
17.2
0.6
0.5
TVS Motor
Neutral
535
-
25,415
13,390
15,948
6.9
7.1
12.8
16.5
41.9
32.3
10.4
8.3
26.3
27.2
1.9
1.6
Amara Raja Batteries
Buy
867
1,009
14,803
5,305
6,100
16.0
16.3
28.4
34.0
30.5
25.5
5.9
4.9
19.3
19.3
2.8
2.4
Exide Industries
Neutral
228
-
19,401
7,439
8,307
15.0
15.0
8.1
9.3
28.2
24.5
3.9
3.5
14.3
16.7
2.2
2.0
Apollo Tyres
Neutral
243
-
12,357
12,877
14,504
14.3
13.9
21.4
23.0
11.3
10.6
1.8
1.5
16.4
15.2
1.1
1.0
Ceat
Neutral
1,786
-
7,225
7,524
8,624
13.0
12.7
131.1
144.3
13.6
12.4
2.5
2.1
19.8
18.6
1.0
0.9
JK Tyres
Neutral
172
-
3,900
7,455
8,056
15.0
15.0
21.8
24.5
7.9
7.0
1.7
1.3
22.8
21.3
0.7
0.6
Swaraj Engines
Neutral
1,876
-
2,329
660
810
15.2
16.4
54.5
72.8
34.4
25.8
10.7
9.7
31.5
39.2
3.4
2.7
Subros
Neutral
254
-
1,522
1,488
1,681
11.7
11.9
6.4
7.2
39.6
35.4
4.2
3.8
10.8
11.4
1.3
1.1
Indag Rubber
Neutral
205
-
539
286
326
19.8
16.8
11.7
13.3
17.6
15.4
3.0
2.8
17.8
17.1
1.6
1.4
Capital Goods
ACE
Neutral
66
-
650
709
814
4.1
4.6
1.4
2.1
46.9
31.3
1.9
1.8
4.4
6.0
1.1
0.9
BEML
Neutral
1,223
-
5,092
3,451
4,055
6.3
9.2
31.4
57.9
38.9
21.1
2.3
2.1
6.3
10.9
1.6
1.3
Bharat Electronics
Neutral
173
-
38,575
8,137
9,169
16.8
17.2
58.7
62.5
2.9
2.8
0.5
0.4
44.6
46.3
3.7
3.3
Stock Watch
June 02, 2017
Company Name
Reco
CMP
Target
Mkt Cap
Sales ( Čcr )
OPM(%)
EPS (Č)
PER(x)
P/BV(x)
RoE(%)
EV/Sales(x)
(Č)
Price ( Č)
( Č cr )
FY17E
FY18E
FY17E
FY18E
FY17E
FY18E
FY17E
FY18E
FY17E
FY18E
FY17E
FY18E
FY17E
FY18E
Capital Goods
Voltas
Neutral
509
-
16,839
6,511
7,514
7.9
8.7
12.9
16.3
39.5
31.2
7.1
6.2
16.7
18.5
2.3
2.0
BGR Energy
Neutral
160
-
1,156
16,567
33,848
6.0
5.6
7.8
5.9
20.5
27.2
1.2
1.1
4.7
4.2
0.2
0.1
BHEL
Neutral
139
-
33,912
28,797
34,742
-
2.8
2.3
6.9
60.2
20.1
1.0
1.0
1.3
4.8
0.8
0.6
Blue Star
Buy
637
760
6,087
4,283
5,077
5.9
7.3
14.9
22.1
42.8
28.8
8.3
7.0
20.4
26.4
1.5
1.2
CG Power and Industrial
Neutral
83
-
5,224
5,777
6,120
5.9
7.0
3.3
4.5
25.3
18.5
1.1
1.1
4.4
5.9
0.9
0.7
Solutions
Greaves Cotton
Neutral
153
-
3,746
1,755
1,881
16.8
16.9
7.8
8.5
19.7
18.1
3.9
3.7
20.6
20.9
1.8
1.7
Inox Wind
Neutral
140
-
3,114
5,605
6,267
15.7
16.4
24.8
30.0
5.7
4.7
1.6
1.2
25.9
24.4
0.6
0.5
KEC International
Neutral
267
-
6,857
9,294
10,186
7.9
8.1
9.9
11.9
26.9
22.4
4.0
3.4
15.6
16.3
1.0
0.9
KEI Industries
Accumulate
220
239
1,710
2,682
3,058
10.4
10.0
11.7
12.8
18.7
17.2
3.8
3.1
20.1
18.2
0.8
0.7
Thermax
Neutral
984
-
11,727
5,421
5,940
7.3
7.3
25.7
30.2
38.3
32.6
4.6
4.2
12.2
13.1
2.0
1.9
VATech Wabag
Neutral
665
-
3,627
3,136
3,845
8.9
9.1
26.0
35.9
25.6
18.5
3.2
2.7
13.4
15.9
1.1
0.8
Cement
ACC
Neutral
1,652
-
31,027
11,225
13,172
13.2
16.9
44.5
75.5
37.1
21.9
3.5
3.2
11.2
14.2
2.8
2.4
Ambuja Cements
Neutral
240
-
47,735
9,350
10,979
18.2
22.5
5.8
9.5
41.5
25.3
3.5
3.1
10.2
12.5
5.1
4.4
India Cements
Neutral
209
-
6,429
4,364
4,997
18.5
19.2
7.9
11.3
26.5
18.5
1.9
1.9
8.0
8.5
2.2
2.0
JK Cement
Neutral
1,104
-
7,719
4,398
5,173
15.5
17.5
31.2
55.5
35.4
19.9
4.3
3.7
12.0
15.5
2.3
1.9
J K Lakshmi Cement
Neutral
485
-
5,712
2,913
3,412
14.5
19.5
7.5
22.5
64.7
21.6
4.0
3.4
12.5
18.0
2.5
2.1
Orient Cement
Neutral
150
-
3,078
2,114
2,558
18.5
20.5
8.1
11.3
18.6
13.3
2.7
2.3
9.0
14.0
2.1
1.6
UltraTech Cement
Neutral
4,195
-
115,151
25,768
30,385
21.0
23.5
111.0
160.0
37.8
26.2
4.8
4.2
13.5
15.8
4.6
3.8
Construction
ITNL
Neutral
101
-
3,332
8,946
10,017
31.0
31.6
8.1
9.1
12.5
11.1
0.5
0.5
4.2
5.0
3.7
3.4
KNR Constructions
Neutral
208
-
2,918
1,385
1,673
14.7
14.0
41.2
48.5
5.0
4.3
0.9
0.8
14.9
15.2
2.2
1.8
Larsen & Toubro
Neutral
1,792
-
167,228
111,017
124,908
11.0
11.0
61.1
66.7
29.3
26.9
3.5
3.3
13.1
12.9
2.5
2.3
Gujarat Pipavav Port
Neutral
150
-
7,237
705
788
52.2
51.7
5.0
5.6
29.9
26.7
3.0
2.7
11.2
11.2
9.9
8.4
Nagarjuna Const.
Neutral
87
-
4,828
8,842
9,775
9.1
8.8
5.3
6.4
16.4
13.6
1.3
1.2
8.2
9.1
0.7
0.6
PNC Infratech
Neutral
146
-
3,733
2,350
2,904
13.1
13.2
9.0
8.8
16.2
16.5
0.6
0.5
15.9
13.9
1.7
1.4
Simplex Infra
Neutral
430
-
2,129
6,829
7,954
10.5
10.5
31.4
37.4
13.7
11.5
1.4
1.3
9.9
13.4
0.7
0.6
Power Mech Projects
Neutral
585
-
861
1,801
2,219
12.7
14.6
72.1
113.9
8.1
5.1
1.5
1.3
16.8
11.9
0.5
0.4
Sadbhav Engineering
Neutral
315
-
5,404
3,598
4,140
10.3
10.6
9.0
11.9
35.0
26.5
3.7
3.2
9.9
11.9
1.8
1.5
NBCC
Neutral
193
-
17,411
7,428
9,549
7.9
8.6
8.2
11.0
23.6
17.6
1.2
0.9
28.2
28.7
2.1
1.5
MEP Infra
Neutral
72
-
1,173
1,877
1,943
30.6
29.8
3.0
4.2
24.1
17.2
11.6
7.8
0.6
0.6
2.0
1.8
Stock Watch
June 02, 2017
Company Name
Reco
CMP
Target
Mkt Cap
Sales ( Čcr )
OPM(%)
EPS (Č)
PER(x)
P/BV(x)
RoE(%)
EV/Sales(x)
(Č)
Price ( Č)
( Č cr )
FY17E
FY18E
FY17E
FY18E
FY17E
FY18E
FY17E
FY18E
FY17E
FY18E
FY17E
FY18E
FY17E
FY18E
Construction
SIPL
Neutral
103
-
3,633
1,036
1,252
65.5
66.2
(8.4)
(5.6)
3.9
4.4
(22.8)
(15.9)
11.7
9.8
Engineers India
Neutral
160
-
10,762
1,725
1,935
16.0
19.1
11.4
13.9
14.0
11.5
1.9
1.9
13.4
15.3
5.2
4.6
Financials
Axis Bank
Accumulate
510
580
122,114
46,932
53,575
3.5
3.4
32.4
44.6
15.8
11.4
2.0
1.8
13.6
16.5
-
-
Bank of Baroda
Neutral
179
-
41,233
19,980
23,178
1.8
1.8
11.5
17.3
15.6
10.3
1.8
1.5
8.3
10.1
-
-
Canara Bank
Neutral
353
-
21,060
15,225
16,836
1.8
1.8
14.5
28.0
24.3
12.6
1.7
1.4
5.8
8.5
-
-
Can Fin Homes
Neutral
2,738
-
7,289
420
526
3.5
3.5
86.5
107.8
31.7
25.4
6.8
5.6
23.6
24.1
-
-
Cholamandalam Inv. &
Buy
1,041
1,230
16,274
2,012
2,317
6.3
6.3
42.7
53.6
24.4
19.4
3.9
3.3
16.9
18.3
-
-
Fin. Co.
Dewan Housing Finance Buy
417
520
13,064
2,225
2,688
2.9
2.9
29.7
34.6
14.0
12.1
2.3
1.5
16.1
14.8
-
-
Equitas Holdings
Buy
157
235
5,296
939
1,281
11.7
11.5
5.8
8.2
27.0
19.1
2.3
2.1
10.9
11.5
-
-
Federal Bank
Accumulate
116
125
20,001
8,259
8,995
3.0
3.0
4.3
5.6
27.0
20.7
2.3
2.1
8.5
10.1
-
-
HDFC
Neutral
1,583
-
251,534
11,475
13,450
3.4
3.4
45.3
52.5
34.9
30.1
6.7
6.0
20.2
20.5
-
-
HDFC Bank
Neutral
1,627
-
418,024
46,097
55,433
4.5
4.5
58.4
68.0
27.9
23.9
4.9
4.1
18.8
18.6
-
-
ICICI Bank
Neutral
320
-
186,509
42,800
44,686
3.1
3.3
18.0
21.9
17.8
14.6
2.4
2.2
11.1
12.3
-
-
Karur Vysya Bank
Buy
119
140
7,161
5,640
6,030
3.3
3.2
8.9
10.0
13.3
11.9
1.4
1.3
11.2
11.4
-
-
Lakshmi Vilas Bank
Neutral
189
-
3,618
3,339
3,799
2.7
2.8
11.0
14.0
17.2
13.5
1.8
1.6
11.2
12.7
-
-
LIC Housing Finance
Neutral
737
-
37,171
3,712
4,293
2.6
2.5
39.0
46.0
18.9
16.0
3.5
3.0
19.9
20.1
-
-
Punjab Natl.Bank
Neutral
151
-
32,228
23,532
23,595
2.3
2.4
6.8
12.6
22.3
12.0
3.4
2.4
3.3
6.5
-
-
RBL Bank
Neutral
549
-
20,646
1,783
2,309
2.6
2.6
12.7
16.4
43.2
33.5
4.7
4.2
12.8
13.3
-
-
Repco Home Finance
Accumulate
785
825
4,913
388
457
4.5
4.2
30.0
38.0
26.2
20.7
4.4
3.7
18.0
19.2
-
-
South Ind.Bank
Neutral
28
-
5,122
6,435
7,578
2.5
2.5
2.7
3.1
10.5
9.2
1.4
1.1
10.1
11.2
-
-
St Bk of India
Neutral
287
-
233,037
88,650
98,335
2.6
2.6
13.5
18.8
21.3
15.3
2.0
1.8
7.0
8.5
-
-
Union Bank
Neutral
158
-
10,841
13,450
14,925
2.3
2.3
25.5
34.5
6.2
4.6
0.9
0.8
7.5
10.2
-
-
Yes Bank
Neutral
1,444
-
65,982
8,978
11,281
3.3
3.4
74.0
90.0
19.5
16.0
3.7
3.1
17.0
17.2
-
-
FMCG
Akzo Nobel India
Neutral
1,805
-
8,657
2,955
3,309
13.3
13.7
57.2
69.3
31.6
26.0
10.3
8.7
32.7
33.3
2.7
2.4
Asian Paints
Neutral
1,159
-
111,166
17,128
18,978
16.8
16.4
19.1
20.7
60.7
56.0
21.1
19.9
34.8
35.5
6.4
5.8
Britannia
Neutral
3,604
-
43,248
9,594
11,011
14.6
14.9
80.3
94.0
44.9
38.3
18.5
14.3
41.2
-
4.4
3.8
Colgate
Neutral
1,038
-
28,225
4,605
5,149
23.4
23.4
23.8
26.9
43.6
38.6
24.1
18.9
64.8
66.8
6.1
5.4
Dabur India
Accumulate
285
304
50,203
8,315
9,405
19.8
20.7
8.1
9.2
35.2
31.0
9.8
8.1
31.6
31.0
5.7
5.0
GlaxoSmith Con*
Neutral
5,311
-
22,338
4,350
4,823
21.2
21.4
179.2
196.5
29.6
27.0
7.9
6.7
27.1
26.8
4.5
4.0
Stock Watch
June 02, 2017
Company Name
Reco
CMP
Target
Mkt Cap
Sales ( Čcr )
OPM(%)
EPS (Č)
PER(x)
P/BV(x)
RoE(%)
EV/Sales(x)
(Č)
Price ( Č)
( Č cr )
FY17E FY18E
FY17E
FY18E
FY17E
FY18E
FY17E
FY18E
FY17E
FY18E
FY17E
FY18E
FY17E
FY18E
FMCG
Godrej Consumer
Neutral
1,817
-
61,870
10,235
11,428
18.4
18.6
41.1
44.2
44.2
41.1
9.8
8.3
24.9
24.8
6.1
5.4
HUL
Neutral
1,095
-
237,083
35,252
38,495
17.8
17.8
20.7
22.4
53.1
48.9
50.7
43.5
95.6
88.9
6.6
6.0
ITC
Neutral
315
-
382,157
40,059
44,439
38.3
39.2
9.0
10.1
35.0
31.0
9.8
8.5
27.8
27.5
9.0
8.1
Marico
Neutral
317
-
40,927
6,430
7,349
18.8
19.5
6.4
7.7
49.6
41.2
15.0
12.6
33.2
32.5
6.2
5.4
Nestle*
Neutral
6,600
-
63,634
10,073
11,807
20.7
21.5
124.8
154.2
52.9
42.8
21.7
19.5
34.8
36.7
6.1
5.2
Tata Global
Neutral
152
-
9,584
8,675
9,088
9.8
9.8
7.4
8.2
20.5
18.5
1.6
1.5
7.9
8.1
1.0
1.0
Procter & Gamble
Neutral
7,560
-
24,539
2,939
3,342
23.2
23.0
146.2
163.7
51.7
46.2
13.1
10.9
25.3
23.5
7.9
6.9
Hygiene
IT
HCL Tech^
Buy
862
1,014
122,985
46,723
52,342
22.1
20.9
60.0
62.8
14.4
13.7
3.6
3.1
25.3
22.4
2.4
2.0
Infosys
Buy
971
1,179
223,022
68,484
73,963
26.0
26.0
63.0
64.0
15.4
15.2
3.2
3.0
20.8
19.7
2.9
2.6
TCS
Neutral
2,551
-
502,627
117,966
127,403
27.5
27.6
134.3
144.5
19.0
17.7
5.7
5.3
29.8
29.7
3.9
3.6
Tech Mahindra
Buy
397
533
38,707
29,141
31,051
14.4
15.0
32.3
35.6
12.3
11.2
2.1
1.9
17.1
17.0
1.2
1.0
Wipro
Accumulate
542
570
131,799
55,421
58,536
20.3
20.3
35.1
36.5
15.4
14.8
2.7
2.3
19.2
14.6
1.8
1.6
Media
D B Corp
Neutral
376
-
6,917
2,297
2,590
27.4
28.2
21.0
23.4
17.9
16.1
4.2
3.6
23.7
23.1
2.8
2.4
HT Media
Neutral
82
-
1,905
2,693
2,991
12.6
12.9
7.9
9.0
10.4
9.1
0.9
0.8
7.8
8.3
0.3
0.2
Jagran Prakashan
Buy
179
225
5,853
2,355
2,635
28.0
28.0
10.8
12.5
16.6
14.3
3.6
3.1
21.7
21.7
2.5
2.2
Sun TV Network
Neutral
803
-
31,655
2,850
3,265
70.1
71.0
26.2
30.4
30.7
26.4
7.8
6.9
24.3
25.6
10.7
9.2
Hindustan Media
Neutral
275
-
2,018
1,016
1,138
24.3
25.2
27.3
30.1
10.1
9.1
1.9
1.7
16.2
15.8
1.3
1.1
Ventures
TV Today Network
Buy
263
344
1,571
567
645
26.7
27.0
15.4
18.1
17.1
14.6
2.6
2.2
14.9
15.2
2.3
2.0
Metals & Mining
Coal India
Neutral
265
-
164,558
84,638
94,297
21.4
22.3
24.5
27.1
10.8
9.8
4.5
4.3
42.6
46.0
1.5
1.3
Hind. Zinc
Neutral
238
-
100,605
14,252
18,465
55.9
48.3
15.8
21.5
15.1
11.1
2.5
2.2
17.0
20.7
7.1
5.5
Hindalco
Neutral
197
-
44,239
107,899
112,095
7.4
8.2
9.2
13.0
21.4
15.2
1.0
1.0
4.8
6.6
0.9
0.9
JSW Steel
Neutral
195
-
47,160
53,201
58,779
16.1
16.2
130.6
153.7
1.5
1.3
0.2
0.2
14.0
14.4
1.6
1.4
NMDC
Neutral
113
-
35,720
6,643
7,284
44.4
47.7
7.1
7.7
15.9
14.7
1.4
1.3
8.8
9.2
3.1
2.8
SAIL
Neutral
57
-
23,397
47,528
53,738
(0.7)
2.1
(1.9)
2.6
21.8
0.6
0.6
(1.6)
3.9
1.3
1.2
Vedanta
Neutral
231
-
85,960
71,744
81,944
19.2
21.7
13.4
20.1
17.3
11.5
1.5
1.3
8.4
11.3
1.6
1.3
Tata Steel
Neutral
498
-
48,357
121,374
121,856
7.2
8.4
18.6
34.3
26.8
14.5
1.7
1.5
6.1
10.1
1.0
1.0
Oil & Gas
GAIL
Neutral
408
-
69,056
56,220
65,198
9.3
10.1
27.1
33.3
15.1
12.3
1.4
1.3
9.3
10.7
1.4
1.2
ONGC
Neutral
174
-
223,106
137,222
152,563
15.0
21.8
19.5
24.1
8.9
7.2
0.8
0.7
8.5
10.1
1.9
1.7
Indian Oil Corp
Neutral
414
-
200,962
373,359
428,656
5.9
5.5
54.0
59.3
7.7
7.0
1.2
1.1
16.0
15.6
0.7
0.6
Stock Watch
June 02, 2017
Company Name
Reco
CMP
Target
Mkt Cap
Sales ( Čcr )
OPM(%)
EPS (Č)
PER(x)
P/BV(x)
RoE(%)
EV/Sales(x)
(Č)
Price ( Č)
( Č cr )
FY17E FY18E
FY17E
FY18E
FY17E
FY18E
FY17E
FY18E
FY17E
FY18E
FY17E
FY18E
FY17E
FY18E
Oil & Gas
Reliance Industries
Neutral
1,329
-
431,953
301,963
358,039
12.1
12.6
87.7
101.7
15.2
13.1
1.6
1.4
10.7
11.3
1.9
1.6
Pharmaceuticals
Alembic Pharma
Buy
532
648
10,035
3,101
3,966
19.7
20.5
21.4
25.5
24.9
20.9
5.3
4.3
23.0
22.8
3.2
2.4
Alkem Laboratories Ltd
Accumulate
1,937
2,161
23,154
5,853
6,901
17.1
18.4
74.6
85.0
26.0
22.8
5.5
4.6
21.1
20.2
3.9
3.3
Aurobindo Pharma
Buy
580
877
33,981
15,720
18,078
23.7
23.7
41.4
47.3
14.0
12.3
3.6
2.9
29.6
26.1
2.4
2.1
Aventis*
Neutral
4,111
-
9,467
2,206
2,508
16.6
16.8
128.9
139.9
31.9
29.4
5.5
4.3
21.6
23.5
4.1
3.4
Cadila Healthcare
Neutral
471
-
48,213
10,429
12,318
17.7
21.6
13.1
19.2
36.0
24.5
7.5
6.0
22.8
27.1
4.7
3.8
Cipla
Reduce
515
465
41,442
15,378
18,089
15.7
16.8
19.3
24.5
26.7
21.0
3.1
2.8
12.3
13.9
2.9
2.4
Dr Reddy's
Neutral
2,520
-
41,749
14,081
15,937
16.1
18.6
72.6
105.9
34.7
23.8
3.4
3.1
9.6
13.6
3.2
2.8
Dishman Pharma
Sell
143
1,718
1,890
22.7
22.8
9.5
11.3
10.1
10.9
3.3
2.9
GSK Pharma*
Neutral
2,460
-
20,839
2,927
3,290
11.8
16.2
34.4
49.6
71.5
49.6
10.4
10.8
13.9
21.3
6.9
6.2
Indoco Remedies
Buy
193
240
1,778
1,112
1,289
16.2
18.2
11.6
16.0
16.6
12.1
2.7
2.2
17.0
20.1
1.7
1.4
Ipca labs
Buy
510
613
6,436
3,258
3,747
12.8
15.3
12.1
19.2
42.2
26.6
2.6
2.4
6.4
9.5
2.1
1.8
Lupin
Buy
1,150
1,809
51,952
15,912
18,644
26.4
26.7
58.1
69.3
19.8
16.6
3.9
3.2
21.4
20.9
3.3
2.7
Natco Pharma
Neutral
944
-
16,463
2,090
2,335
32.1
26.6
26.8
23.2
35.2
40.7
10.0
8.6
28.4
21.1
7.9
97.5
Sun Pharma
Buy
509
847
122,001
31,129
35,258
32.0
32.9
30.2
35.3
16.8
14.4
2.7
2.3
20.0
20.1
3.5
2.9
Power
Tata Power
Neutral
81
-
21,828
36,916
39,557
17.4
27.1
5.1
6.3
15.8
12.8
1.4
1.3
9.0
10.3
1.6
1.4
NTPC
Neutral
160
-
132,092
86,605
95,545
17.5
20.8
11.8
13.4
13.6
12.0
1.4
1.3
10.5
11.1
2.9
2.9
Power Grid
Accumulate
208
223
108,686
25,315
29,193
88.2
88.7
14.2
17.2
14.7
12.1
2.2
1.9
15.2
16.1
8.9
8.0
Real Estate
Prestige Estate
Neutral
248
-
9,317
4,707
5,105
25.2
26.0
10.3
13.0
24.1
19.1
1.9
1.8
10.3
10.2
3.2
2.8
MLIFE
Buy
424
522
2,174
1,152
1,300
22.7
24.6
29.9
35.8
14.2
11.8
1.1
1.0
7.6
8.6
2.6
2.2
Telecom
Bharti Airtel
Neutral
367
-
146,765
105,086
114,808
34.5
34.7
12.2
16.4
30.1
22.4
2.0
1.9
6.8
8.4
2.3
2.0
Idea Cellular
Neutral
80
-
28,738
40,133
43,731
37.2
37.1
6.4
6.5
12.5
12.3
1.0
1.0
8.2
7.6
1.7
1.5
zOthers
Abbott India
Neutral
4,199
-
8,923
3,153
3,583
14.1
14.4
152.2
182.7
27.6
23.0
135.5
115.7
25.6
26.1
2.5
2.2
Asian Granito
Accumulate
380
405
1,145
1,060
1,169
12.2
12.5
12.7
15.9
30.0
23.9
2.9
2.6
9.5
10.7
1.4
1.2
Bajaj Electricals
Buy
341
395
3,453
4,801
5,351
5.7
6.2
10.4
13.7
32.7
24.9
4.0
3.6
12.4
14.5
0.7
0.6
Banco Products (India)
Neutral
228
-
1,631
1,353
1,471
12.3
12.4
14.5
16.3
15.7
14.0
21.7
19.6
14.5
14.6
1.1
123.2
Coffee Day Enterprises
Neutral
248
-
5,103
2,964
3,260
20.5
21.2
4.7
8.0
-
31.0
2.9
2.6
5.5
8.5
2.1
1.9
Ltd
Competent Automobiles Neutral
195
-
125
1,137
1,256
3.1
2.7
28.0
23.6
7.0
8.3
37.6
34.0
14.3
11.5
0.1
0.1
Elecon Engineering
Neutral
64
-
720
1,482
1,660
13.7
14.5
3.9
5.8
16.5
11.1
3.9
3.6
7.8
10.9
0.8
0.7
Stock Watch
June 02, 2017
Company Name
Reco
CMP
Target
Mkt Cap
Sales ( Čcr )
OPM(%)
EPS (Č)
PER(x)
P/BV(x)
RoE(%)
EV/Sales(x)
(Č)
Price ( Č)
( Č cr )
FY17E
FY18E
FY17E
FY18E
FY17E
FY18E
FY17E
FY18E
FY17E
FY18E
FY17E
FY18E
FY17E
FY18E
zOthers
Finolex Cables
Neutral
500
-
7,649
2,883
3,115
12.0
12.1
14.2
18.6
35.2
26.9
18.7
16.4
15.8
14.6
2.3
2.1
Garware Wall Ropes
Neutral
813
-
1,779
863
928
15.1
15.2
36.4
39.4
22.3
20.6
4.0
3.5
17.5
15.9
2.0
1.8
Goodyear India*
Neutral
837
-
1,931
1,598
1,704
10.4
10.2
49.4
52.6
17.0
15.9
78.3
68.6
18.2
17.0
0.9
126.7
Hitachi
Neutral
2,208
-
6,004
2,081
2,433
8.8
8.9
33.4
39.9
66.1
55.3
53.3
44.5
22.1
21.4
2.9
2.4
HSIL
Neutral
345
-
2,491
2,384
2,515
15.8
16.3
15.3
19.4
22.5
17.8
22.4
19.3
7.8
9.3
1.2
1.1
Interglobe Aviation
Neutral
1,130
-
40,855
21,122
26,005
14.5
27.6
110.7
132.1
10.2
8.6
61.1
43.6
168.5
201.1
1.9
1.5
Jyothy Laboratories
Neutral
367
-
6,676
1,440
2,052
11.5
13.0
8.5
10.0
43.2
36.7
10.5
9.7
18.6
19.3
4.9
3.4
Kirloskar Engines India
Neutral
383
-
5,539
2,554
2,800
9.9
10.0
10.5
12.1
36.5
31.7
15.3
14.4
10.7
11.7
1.8
1.6
Ltd
Linc Pen & Plastics
Neutral
266
-
393
382
420
9.3
9.5
13.5
15.7
19.8
16.9
3.4
2.9
17.1
17.3
1.1
1.0
M M Forgings
Neutral
620
-
748
546
608
20.4
20.7
41.3
48.7
15.0
12.7
84.9
75.2
16.6
17.0
1.2
1.1
Manpasand Bever.
Neutral
796
-
4,555
836
1,087
19.6
19.4
16.9
23.8
47.1
33.4
5.7
4.9
12.0
14.8
5.2
3.9
Mirza International
Neutral
145
-
1,743
963
1,069
17.2
18.0
6.1
7.5
23.6
19.3
3.6
3.1
15.0
15.7
2.0
1.8
MT Educare
Neutral
68
-
273
366
417
17.7
18.2
9.4
10.8
7.3
6.3
1.6
1.4
22.2
22.3
0.6
0.6
Narayana Hrudaya
Neutral
336
-
6,870
1,873
2,166
11.5
11.7
2.6
4.0
127.1
84.8
7.8
7.0
6.1
8.3
3.8
3.2
Navkar Corporation
Buy
218
265
3,109
369
561
42.9
42.3
6.9
11.5
31.6
18.9
2.2
2.0
7.4
10.5
9.4
6.2
Navneet Education
Neutral
180
-
4,213
1,062
1,147
24.0
24.0
6.1
6.6
29.6
27.2
6.1
5.4
20.6
19.8
4.0
3.7
Nilkamal
Neutral
1,995
-
2,978
1,995
2,165
10.7
10.4
69.8
80.6
28.6
24.8
114.0
99.1
16.6
16.5
1.5
1.3
Page Industries
Neutral
14,208
-
15,847
2,450
3,124
20.1
17.6
299.0
310.0
47.5
45.8
316.4
241.6
47.1
87.5
6.5
5.1
Parag Milk Foods
Neutral
237
-
1,992
1,919
2,231
9.3
9.6
9.5
12.9
25.1
18.3
3.9
3.2
15.5
17.5
1.2
1.0
Quick Heal
Neutral
219
-
1,533
408
495
27.3
27.0
7.7
8.8
28.2
24.9
2.6
2.6
9.3
10.6
2.9
2.4
Radico Khaitan
Buy
124
147
1,656
1,667
1,824
13.0
13.2
6.7
8.2
18.7
15.2
1.7
1.5
9.0
10.2
1.4
1.2
Relaxo Footwears
Neutral
465
-
5,583
2,085
2,469
9.2
8.2
7.6
8.0
61.5
58.5
23.8
20.4
17.9
18.8
2.8
2.4
S H Kelkar & Co.
Neutral
287
-
4,147
1,036
1,160
15.1
15.0
6.1
7.2
47.0
40.0
5.0
4.6
10.7
11.5
3.9
3.4
Siyaram Silk Mills
Accumulate
1,971
2,200
1,848
1,652
1,857
11.6
11.7
92.4
110.1
21.3
17.9
3.1
2.7
14.7
15.2
1.3
1.2
Styrolution ABS India*
Neutral
772
-
1,358
1,440
1,537
9.2
9.0
40.6
42.6
19.0
18.1
48.6
44.1
12.3
11.6
0.9
0.8
Surya Roshni
Neutral
283
-
1,241
3,342
3,625
7.8
7.5
17.3
19.8
16.4
14.3
31.1
25.0
10.5
10.8
0.6
0.6
Team Lease Serv.
Neutral
1,206
-
2,062
3,229
4,001
1.5
1.8
22.8
32.8
53.0
36.7
5.7
4.9
10.7
13.4
0.5
0.4
The Byke Hospitality
Neutral
188
-
755
287
384
20.5
20.5
7.6
10.7
24.8
17.6
5.2
4.2
20.7
23.5
2.7
2.0
Transport Corporation of
Neutral
318
-
2,434
2,671
2,911
8.5
8.8
13.9
15.7
22.9
20.3
3.1
2.8
13.7
13.8
1.0
0.9
India
Stock Watch
June 02, 2017
Company Name
Reco
CMP
Target Mkt Cap
Sales ( Čcr )
OPM(%)
EPS (Č)
PER(x)
P/BV(x)
RoE(%)
EV/Sales(x)
(Č)
Price ( Č)
( Č cr )
FY17E FY18E FY17E FY18E FY17E FY18E FY17E FY18E FY17E FY18E FY17E FY18E FY17E FY18E
zOthers
TVS Srichakra
Neutral
4,063
-
3,111
2,304
2,614
13.7
13.8
231.1
266.6
17.6
15.2
456.5
359.4
33.9
29.3
1.4
1.2
UFO Moviez
Neutral
377
-
1,040
619
685
33.2
33.4
30.0
34.9
12.6
10.8
1.7
1.5
13.8
13.9
1.4
1.1
Visaka Industries
Neutral
411
-
652
1,051
1,138
10.3
10.4
21.0
23.1
19.6
17.8
52.7
49.3
9.0
9.2
0.9
0.8
VRL Logistics
Neutral
325
-
2,968
1,902
2,119
16.7
16.6
14.6
16.8
22.3
19.3
4.9
4.3
21.9
22.2
1.7
1.5
VIP Industries
Accumulate
198
218
2,797
1,270
1,450
10.4
10.4
5.6
6.5
35.3
30.5
7.3
6.4
20.7
21.1
2.2
1.9
Navin Fluorine
Buy
2,901
3,650
2,840
789
945
21.1
22.4
120.1
143.4
24.2
20.2
3.9
3.4
17.8
18.5
3.5
2.9
Source: Company, Angel Research; Note: *December year end; #September year end; &October year end; Price as on June 01, 2017
Market Outlook
June 02, 2017
Research Team Tel: 022 - 39357800
DISCLAIMER
Angel Broking Private Limited (hereinafter referred to as “Angel”) is a registered Member of National Stock Exchange of India
Limited,Bombay Stock Exchange Limited and Metropolitan Stock Exchange Limited. It is also registered as a Depository Participant with
CDSL and Portfolio Manager with SEBI. It also has registration with AMFI as a Mutual Fund Distributor. Angel Broking Private Limited is a
registered entity with SEBI for Research Analyst in terms of SEBI (Research Analyst) Regulations, 2014 vide registration number
INH000000164. Angel or its associates has not been debarred/ suspended by SEBI or any other regulatory authority for accessing
/dealing in securities Market. Angel or its associates/analyst has not received any compensation / managed or
co-managed public offering of securities of the company covered by Analyst during the past twelve months.
This document is solely for the personal information of the recipient, and must not be singularly used as the basis of any investment
decision. Nothing in this document should be construed as investment or financial advice. Each recipient of this document should make
such investigations as they deem necessary to arrive at an independent evaluation of an investment in the securities of the companies
referred to in this document (including the merits and risks involved), and should consult their own advisors to determine the merits and
risks of such an investment.
Reports based on technical and derivative analysis center on studying charts of a stock's price movement, outstanding positions and
trading volume, as opposed to focusing on a company's fundamentals and, as such, may not match with a report on a company's
fundamentals. Investors are advised to refer the Fundamental and Technical Research Reports available on our website to evaluate the
contrary view, if any.
The information in this document has been printed on the basis of publicly available information, internal data and other reliable
sources believed to be true, but we do not represent that it is accurate or complete and it should not be relied on as such, as this
document is for general guidance only. Angel Broking Pvt. Limited or any of its affiliates/ group companies shall not be in any way
responsible for any loss or damage that may arise to any person from any inadvertent error in the information contained in this report.
Angel Broking Pvt. Limited has not independently verified all the information contained within this document. Accordingly, we cannot
testify, nor make any representation or warranty, express or implied, to the accuracy, contents or data contained within this document.
While Angel Broking Pvt. Limited endeavors to update on a reasonable basis the information discussed in this material, there may be
regulatory, compliance, or other reasons that prevent us from doing so.
This document is being supplied to you solely for your information, and its contents, information or data may not be reproduced,
redistributed or passed on, directly or indirectly.
Neither Angel Broking Pvt. Limited, nor its directors, employees or affiliates shall be liable for any loss or damage that may arise from
or in connection with the use of this information.